How to Properly Optimize an Expert Advisor (EA) in MT4
Data is continually updated by our staff and systems.
Last updated: 14 Apr 2020
We earn commissions from some affiliate partners at no extra cost to users (partners are listed on our ‘About Us’ page in the ‘Partners’ section). Despite these affiliations, our content remains unbiased and independent. We generate revenue through banner advertising and affiliate partnerships, which do not influence our impartial reviews or content integrity. Our editorial and marketing teams operate independently, ensuring the accuracy and objectivity of our financial insights.
Read more about us ⇾
It would be nice to develop trading systems without giving a thought to optimization. Realistically, however, the development of a profitable trading strategy is a trial-and-error activity in which some form of optimization always plays a role. There is always an optimizer around somewhere - if not visible on the table, then lurking in the shadows.
- J. Katz, D. Mccormick. The Encyclopedia of trading Strategies.
Learn in this article how to properly optimize an Expert Advisor (EA) in MT4, from backtesting to choosing the best model type.
One of the truly powerful features of Metatrader 4 is its built in optimizer that allows you to test hundreds of combinations of expert advisor settings to find the most fitting and profitable. It is all the power of backtesting and infinitely more.
It can display hundreds of backest results (of any range of variables within a parameter and combinations of parameters) in a lovely table sortable by noteworthy statistics such as Net Profit, Profit Factor, and Maximal Drawdown. You can then review at a glance how each of these different settings performed historically, giving you a larger picture of how your strategy works in relation to all its parts. Even more relevant, this larger picture allows you to pick out the best parameter values in order to enhance your EA.
The optimizer will return and order the results of different settings for the selected date range, making it easier for the user to find the most appropriate combinations.

In order to optimize your expert advisor, you can insert the expert advisor on to your chart and then right click Expert Advisors/Strategy Tester or F6. This will populate the Strategy Tester with the name of the expert Advisor, the symbol, the modeling type, and period.
Alternatively, you can select the name of the EA form the Expert Advisor drop-down box, select the currency form the Symbol box, and chart period from the Period box. For model, you can choose between three model types: 1) Every tick (the most precise method based on available least timeframes to generate each tick); 2) Control points (a very crude method based on the nearest less timeframe, the results may not be considered); and 3) Open prices only (fastest method to analyze the bar just completed, only for EAs that explicitly control bar opening).
Left click the Expert Properties button to open your expert advisor settings. Under the Testing tab, you will see the initial deposit with a drop down from 500 to 50,000 and any number can be added in here and represented in USD, EUR, GBP, CHF. I generally test with $10,000 USD or anything realistic to the strategy being tested. I keep the other fields in this tab as defaults, unless I am wanting to test Long only or Short only instead of Long & Short.
The middle tab, Inputs, is where you can enter the range of values to optimize for. The lowest value for a given setting will be in the Start column, and the highest will be the Stop column. The Step column is the amount that the optimizer will “step through” from the Start to the Stop setting.

In the image above we are optimizing FastMAPeriod and SlowMAPeriod for the MACross expert advisor. For the FastMAPeriod, the Start value is 15, the Step is 5, and the Stop is 50. The optimizer will test every combination of values from 15, 20, 25 and so on up to 50. For the SlowMAPeriod, the Start value is 50, the Step is 25, and the Stop is 250.
The optimizer will test every combination of values from 50,75,100 and so on up to 250. It is important to use the Start, Step and Stop values that are appropriate to the settings. Since the FastMA must show a shorter length than the SlowMA, I needed to use a much smaller Start, Step and Stop.
You can place a checkbox to the far left of the setting to be optimized. All settings that are not checked will use the number in the Value column. Note: it is best to optimize with no more than 3 settings checked at a time. Your optimizer will be quicker and your comparison of results will be easier to read and decipher.
When you are ready to optimize, you can hit the Start button at the bottom right of the Strategy Tester window. Depending on the period, the date range, the testing model and the number of settings to be optimized, it can take anywhere from a few minutes to several hours. If it is taking too long, consider changing the testing model, shortening the date range, optimizing with fewer settings, or using a larger step value.

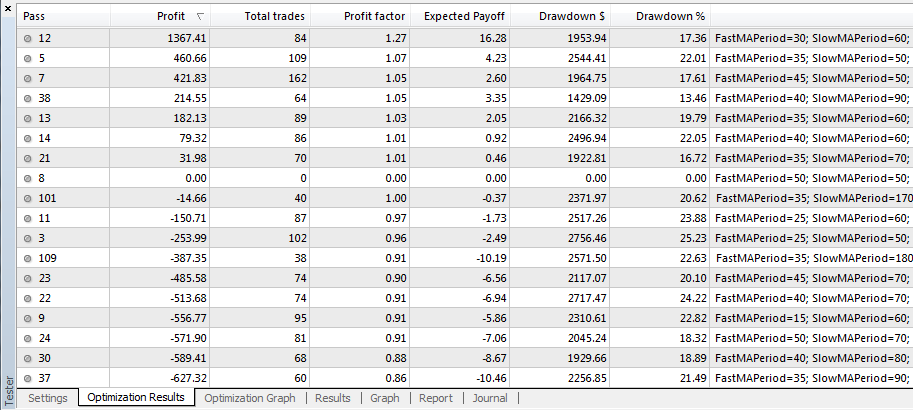
Once the optimization is finished, open the Optimization Results tab and double-click the Profit column or Profit Factor column to sort the results. It is also advisable to right click on Optimization of Results and deselect Skip Useless Results (this only has to be done once and never again).
In the above example, if I had kept the check on Skip Useless Results, it would have shown only shows 7 of the 168 optimizations (only the profitable ones), ignoring the 161 negative results. Though I could not copy and paste all the 161 negative results here, I find them useful because they tell me that this strategy, as is, on this timeframe and currency, is more bad than good and only a few isolated combinations are profitable.
It is always a good idea to right click on Optimization Results, and click Save as Report. This will allow you to save an html report of your optimization for later reference. The only problem with this method is that it does not save the parameter values that you have optimized – and so unless you have photographic memory, it is impossible to remember which pass number corresponded to which combination. There is an alternative workaround to this.
You can write click on Optimization Results and click Copy All and then Paste the whole table in a worksheet of an Excel document. If you plan to conduct several different types of optimizations, such as different combinations on different timeframes and currencies, laying them all out on different worksheets is the best way for you to compare and contrast the optimizations.
Another way of viewing your results is seeing it in an optimization graph, which can be in either 2D or 3D. The 2D optimization plots the linear progression from the initial pass through to the final pass, and if the graph remains choppy throughout, it can confirm that there are no distinct combinations that rise above the rest.
You can also switch to the 3D mode and see shades of green that can help you spot those parameters that are not only good but living in the best (greenest) neighbourhood. Sounds very environmental. Generally speaking, there is more reason to attribute greater statistical worth to those parameters living in the greenest (darker) neighborhood. That is, all surrounding paramaters of the optimal have deeper shades of green.
If the optimal parameter reside in a dark green areas then its performance is less an anomaly due to over-optimization and more something real and worth paying attention to. Mouse can be hovered over any green block to see the pass number, parameter combination and values, and balance. There is nice article written about how to avoid over-optimization by using the 3D graph to look for green neighborhoods. http://articles.mql4.com/479
You can double-click on any of the results laid out in the Optimization Results to load it into the tester. Hit the Start button again to backtest with the selected settings to view the equity curve and more statistics on the optimized strategy.
Finally, make sure you are aware of all the Steps to Minimize Overoptimization.

