How to Backtest an MT4 EA

To get the best performance out of your MT4 EA (Metatrader Expert Advisor) you will need to optimize and backtest it. In this article learn how to do it with Metatrader’s Strategy Tester.
Forward testing on a demo account is essential, but it takes a lot of time before you get a good idea about how the expert advisor will perform. Backtesting allows you to simulate trading over a long period of time in just minutes.
Before you start your backtest you will need to make sure you have complete and accurate history set up. If you modeling quality is less than 90% or you see mismatched chart errors, then your data is insufficient. To download history data and learn how to set it up, read this article from Metatrader 4.
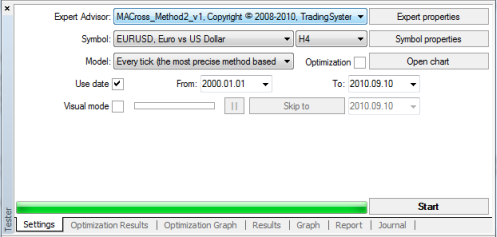
To open the Metatrader backtesting window, select from the top menu View > Strategy Tester (or Ctrl +R for the shortcut). The window should open in the bottom of the terminal and look like this:

In order to backtest your expert advisor, you select your Expert Advisor, Symbol, Period (time frame you want), Model (such as Every Tick), check the Use Date box and select the date range. Select the Visual Mode if you want a visual walkthrough of the backtesting. It is a good tool for checking the logic of your expert advisor and to spot any errors, but it takes more time to perform so you want to only use it on short history samples. Leave Optimization unchecked.
Click the Expert Properties button and select Testing tab, and enter an Initial deposit value and leave everything else the same. Select the Inputs tab, and enter your settings in the Value column under the Inputs tab. Change what you want or leave the default settings. You can also load or save settings using the buttons int he bottom right. The Start, Step, and Stop columns are ignored, as are the checkboxes.
Close the Expert Properties dialog and press Start to begin testing. Depending on your EA and settings and computer memory, it make take several minutes to hours to complete. Once the testing has finished, open the Report tab on the bottom to see the results.

Analyzing the Backtest Report
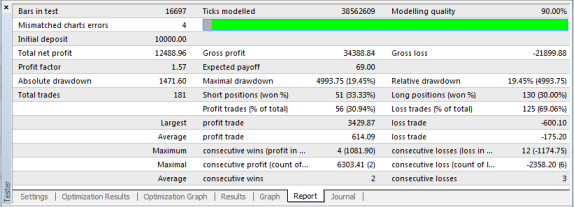
The report above displays all the statistics of the backtest. A few statistics to take note of are:
- Modeling quality – Only important if your testing model is Every Tick. If so, this should be at 90%. If not, follow the instructions above to update your history with accurate M1 data.
- Total net profit – The Gross profit minus the Gross loss.
- Profit factor – The ratio of gross profit to gross loss. Higher is better, anything above 2 is acceptable.
- Maximal drawdown – The highest difference between one of local upper extremums of the balance graph and the following lower extremum:MaximalDrawDown = Max of (Maximal Peak – next Minimal Peak)
- Absolute drawdown – The drawdown of your initial deposit. It is worth noting but it is not as valuable as the maximal drawdown because your EA might have had good initial start.
- Profit trades – Your overall win percentage.
- Maximum consecutive losses (loss in money) – maximum consecutive amount of losses among losing series of trades and the summed up loss within this series.
- Maximal consecutive loss (count of losses) – maximum loss of a consecutive series of losing trades and the amount of trades in this series;
For a comprehensive and detailed description of all the stats, visit the following article: https://www.mql5.com/en/articles/1486
Putting these stats together
Drawdown amount is the first thing you look at – especially in relation to initial deposit. Then look at max consecutive losses in money. You are looking for “whats the worst this could do to me”. Assuming this is good quality live-account history from your own broker, then you look at PF, which should be at least 1.5 for a frequent trading EA (providing the StopLoss is not huge). For a more typical EA, I would look for 2+ over a long period. Keep in mind, the results in live trading will be less good – maybe by a large amount if your system is vulnerable to spread variation.
Reading the Results Tab
The Results tab at the bottom of the strategy tester will give you the details on opened and closed orders, including trailing stop, take profit and stop loss.
Visualizing the Graph
Click Graph tab to get a visual representation of your results in the form of an equity curve. A historically choppy equity curve represents an EA that is volatile, while a smooth curve represents a more stable EA.
You should also be looking at the graph for its peaks and valleys. The maximal drawdown gives you an idea of the largest peak and valley and perhaps you can find it on graph. Maximal drawdown gives you a feel for the worst case scenario. You can try to imagine if this worst case scenario occured on the first trade.
Try to identify other peaks and valleys and see often they occur and for how long.
When testing your new EA, examine these closely to ensure that your strategy is working as intended.

